Ontological Differences: Work Sampling vs. Timing
En la gestión de operaciones moderna, nos enfrentamos a una disyuntiva epistemológica fundamental: ¿Debemos medir la duración determinista de un ciclo o la…
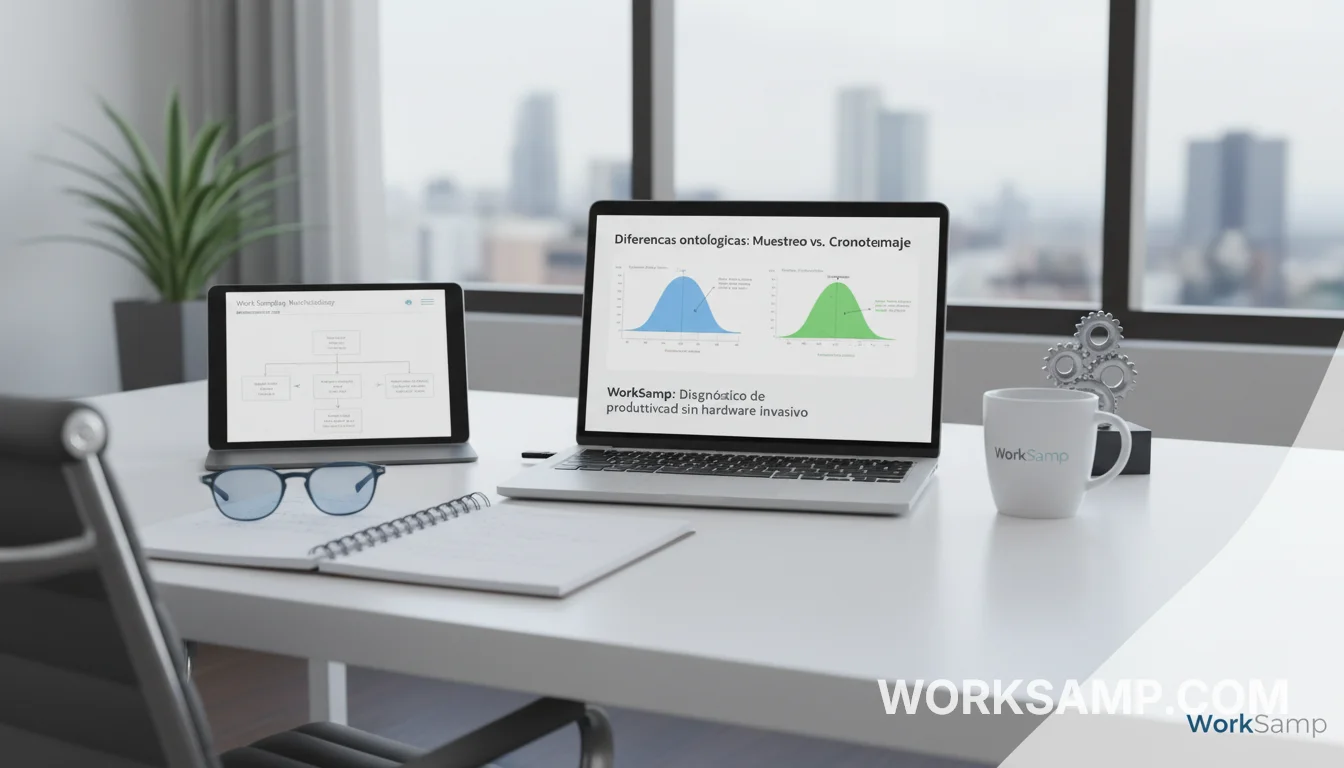
In modern operations management, we face a fundamental epistemological dilemma: Should we measure the deterministic duration of a cycle or the probabilistic frequency of a state?
For decades, the stopwatch was the king of the plant floor. However, in the era of Industry 5.0, characterized by high variability, mass personalization, and strict data privacy regulations (GDPR), traditional timing has become obsolete for systemic diagnostics.
This technical article breaks down why Work Sampling (Tippett Method) is not only an alternative but an ontologically superior methodology to Time Study for obtaining an accurate X-ray of productivity, Wrench Time, and real OEE, without the need for invasive hardware or human biases.
Ontological Foundation: Differences Between State (Discrete) and Flow (Continuous)
For a Plant Engineer, understanding the nature of the data is as critical as the data itself. The difference between timing and sampling lies in how we capture operational reality.
The Limitation of Timing and the Hawthorne Effect
Timing (Time Study) assumes event linearity. It is based on continuous 1:1 observation. However, its greatest weakness is the Hawthorne Effect: the alteration of a subject's behavior when they know they are being observed.
When an analyst stands in front of an operator with a stopwatch or tablet, the dependent variable (performance) is artificially modified. The operator "performs" for the measurement, accelerating the pace or following procedures they usually ignore. This generates a representative sample fallacy: we obtain precise data from a simulated reality, not from everyday operation.
The Stochastic Superiority of Work Sampling
Work Sampling, based on L.H.C. Tippett's technique, operates under stochastic logic. Instead of chasing time, we capture discrete states through Snap Readings (Instantaneous Readings).
The observation is a millisecond "photograph." By being performed randomly, the operator has no reaction time to modify their conduct.
- Mathematical Foundation: Law of Large Numbers.
- Validation: The accumulation of discrete observations mathematically converges toward the reality of Wrench Time and real OEE, eliminating the bias of continuous observation.
Mathematical Rigor: Statistical Inference as the Basis of Decision
At WorkSamp, we do not work with subjective estimates ("I think we lose time on format changes"), we work with pure statistical inference. We transform qualitative observations into robust quantitative data through the Binomial Distribution approximated by the Gauss Curve.
The Gauss Curve and MECE Taxonomy
For the probabilistic model to be valid, data collection must be based on a MECE (Mutually Exclusive, Collectively Exhaustive) taxonomy.
It is not enough to observe. We must categorize clear binary states (e.g., Value Added vs. Muda). If categories are ambiguous, the binomial distribution fails. The WorkSamp methodology ensures that each Snap Reading feeds a structured database that allows modeling the Gauss bell curve of plant productivity with scientific precision.
Sample Size Calculation (N) and Confidence Level (Z)
To validate a study before Management or an ISO 9001 audit, the sample size is not guessed, it is calculated. The critical formula we use is:
$N = \frac{Z^2 \cdot p \cdot (1-p)}{E^2}$
Where:
- $N$: Sample size (total number of observations).
- $Z$: Confidence level (typically 1.96 for 95% or 2.58 for 99%).
- $p$: Estimated probability of event occurrence (e.g., preliminary Wrench Time).
- $E$: Acceptable margin of error.
Practical Case:
A supervisor may estimate "by eye" an efficiency of 60%. That is not auditable.
A WorkSamp study with $N=3000$, a confidence level of 95% ($Z=1.96$) and an error of $\pm 2\%$, provides a technically irrefutable data point for CAPEX decision-making.
Cost and Viability Analysis: Invasive Hardware vs. Statistics
In the current economic scenario and with the regulatory projection toward 2025, cost efficiency and legal compliance are mandatory.
OEE Without Sensors and the Privacy Challenge (EU AI Act)
The implementation of IIoT (Sensors) or computer vision systems entails high infrastructure and maintenance cost. Furthermore, the EU AI Act and GDPR will impose severe restrictions on the use of cameras and biometrics to measure individual performance ("Digital Surveillance").
Work Sampling offers an elegant solution:
- OEE Without Sensors: Captures micro-stops and speed losses that sensors often ignore or cannot categorize (human causes).
- Regulatory Compliance: By relying on random and anonymous observations, it protects worker privacy, complying with Industry 5.0 ethical standards and avoiding union conflicts.
Data Simulation: "Metalworking Plant" Case
Below, we present a comparison based on real simulation data from a plant with 15 maintenance technicians.
| Variable | Method A: Timing | Method B: WorkSamp (Tippett) |
|---|---|---|
| Resource | 2 Engineers (48 hours) | 1 Engineer (Random rounds) |
| Coverage | 13% of staff | 100% of staff |
| Bias | High (Hawthorne Effect) | None (Snap Reading) |
| Wrench Time | 45% (Inflated) | 32% (Real) |
| Margin of Error | Unknown | $\pm 1.4\%$ (Calculated) |
Conclusion: The WorkSamp method revealed that real productivity was 13% lower than observed under direct pressure, allowing management to tackle the real root problems (material waits and travel) instead of pressuring operators.
The WorkSamp Solution: Non-Invasive Productivity Diagnosis
At WorkSamp, we understand that Plant Engineers and Operations Directors do not need more spreadsheets, they need certainty.
Our value proposition moves away from traditional consulting based on man-hours. We offer:
- Scientific Methodology: Statistical rigor based on $N$ calculation and $Z$ control.
- Non-Invasive Diagnosis: No cameras, no intimidating stopwatches, no costly sensors.
- "Board-Ready" Deliverables: Wrench Time and OEE reports backed by statistical inference, ready to withstand any audit or board meeting.
Don't guess where you are losing money. Calculate it.
Would your productivity diagnosis withstand a mathematical audit?
Stop relying on intuition and start trusting statistics.
[Request a preliminary Sample Size (N) calculation for your plant today]
Frequently Asked Questions (Technical FAQ)
What is the main difference between work sampling and time study?
Time study measures the duration of a specific cycle and is deterministic. Work sampling measures the frequency (proportion) of an activity within total time and is probabilistic, ideal for non-repetitive tasks or long cycles.
How many observations are needed for a valid Work Sampling study?
It depends on the required precision. For a 95% confidence level and $\pm 3\%$ error, generally between 1,000 and 3,000 observations are required, calculated using the formula $N = \frac{Z^2 \cdot p \cdot (1-p)}{E^2}$.
How does GDPR affect time control in 2025?
GDPR and the EU AI Act restrict mass surveillance and the use of biometric data to evaluate performance. Work Sampling, being anonymous and aggregated (does not follow an individual continuously), is the legally safest methodology to diagnose productivity.
Is Work Sampling applicable to non-repetitive tasks?
Absolutely. That is its greatest competitive advantage. While timing fails in maintenance, logistics, or supervision (where there are no fixed cycles), sampling accurately captures the time distribution in these complex areas.